PIZZA SALES
REPORT
I conducted an analysis on pizza sales to uncover key insights into the company's business performance. The project involved examining sales trends, customer preferences, and operational efficiency, providing data-driven recommendations to enhance profitability and customer satisfaction..
Introduction
This report presents an analysis of the pizza sales performance for the company over a 12-month period. The objective of the analysis was to uncover key insights and trends in sales data to inform strategic decisions and enhance business performance.
Data Sources and Methodology
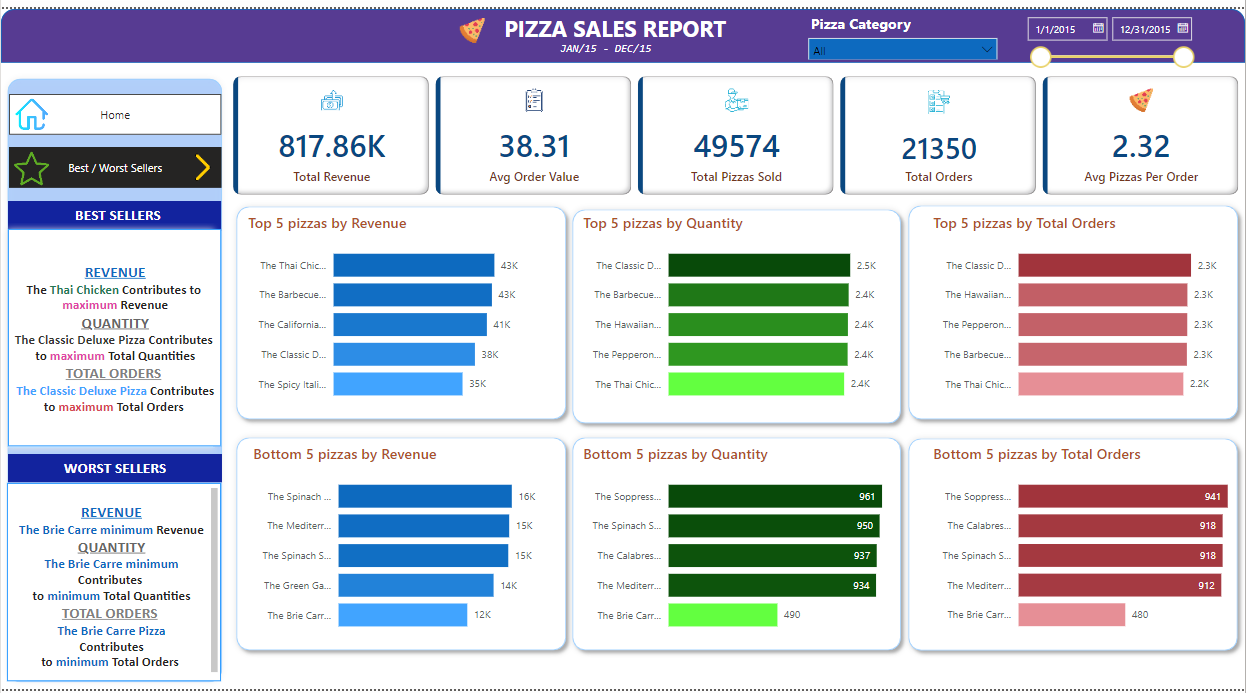
The data for this analysis was sourced from the company's sales records, covering a full year. Key metrics analyzed included:
- Total Revenue: The sum of the total price of all pizza orders.
- Average Order Value: The average amount spent per order, calculated by dividing the total revenue by the total number of orders.
- Total Pizzas Sold: The sum of the quantities of all pizzas sold.
- Total Orders: The total number of orders placed.
- Average Pizzas Per Order: The average number of pizzas sold per order, calculated by dividing the total number of pizzas sold by the total number of orders.
The analysis was conducted using SQL for data extraction and cleaning, Excel for data manipulation and calculations, and Power BI for data visualization.
Key Findings
Revenue
- Maximum Revenue: The Thai Chicken pizza contributed the most to total revenue.
- Minimum Revenue: The Brie Carre pizza contributed the least to total revenue.
Quantity
- Maximum Quantities Sold: The Classic Deluxe pizza had the highest total quantities sold.
- Minimum Quantities Sold: The Brie Carre pizza had the lowest total quantities sold.
Orders
- Maximum Total Orders: The Classic Deluxe pizza had the highest total orders.
- Minimum Total Orders: The Brie Carre pizza had the lowest total orders.
Temporal Trends
- Days: Orders were highest on weekends, particularly on Friday and Saturday evenings.
- Monthly: Maximum orders were observed in the months of July and January.
Categories and Sizes
- Category: The Classic category contributed to the maximum sales and total orders.
- Size: Large size pizzas contributed to the maximum sales.
Recommendations
- Menu Optimization: Focus marketing and promotional efforts on high-revenue pizzas like the Thai Chicken and Classic Deluxe. Consider revising or promoting low-performing items like the Brie Carre to boost their sales or possibly phase them out if they continue to underperform.
- Targeted Promotions: Increase promotional activities on weekends, particularly Friday and Saturday evenings, to capitalize on the high order volumes.
- Seasonal Campaigns: Leverage the months with peak orders (July and January) by running special campaigns or discounts to maximize sales during these periods.
- Product Development: Explore introducing more large-size options or meal deals, as large pizzas contribute significantly to revenue.
- Customer Insights: Conduct surveys or gather customer feedback to understand preferences and improve product offerings, particularly for the low-performing pizzas.
Challenges
During data cleaning, it was noted that some necessary datasets were not fully represented. As a result, assumptions had to be made, which could potentially affect the accuracy of the analysis.
Conclusion
The analysis of the pizza sales data provided valuable insights into the company's performance over the past year. By implementing the recommended strategies, the company can enhance its revenue, optimize its product offerings, and better meet customer preferences. Despite the challenges faced with data completeness, the findings offer a robust foundation for strategic decision-making.
Files Used
To review the datasets and analysis files used in this report, please follow the link below: →